War in Europe! How has Agriculture Changed in the Context of the Ukraine Conflict? A Remote Sensing Approach in a UNIGIS Master Thesis

In the course of my UNIGIS Master Thesis, titled “Agricultural Change Detection Under Military Conflict Using the Example of Ukraine War”, I took a closer look at the impact of the Ukraine conflict. How has agriculture changed, and what conclusions can we draw from it? An examination of a current and explosive conflict that is happening less than 2000 kilometers from Salzburg away.
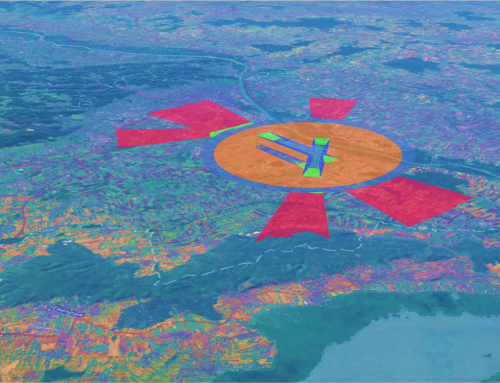
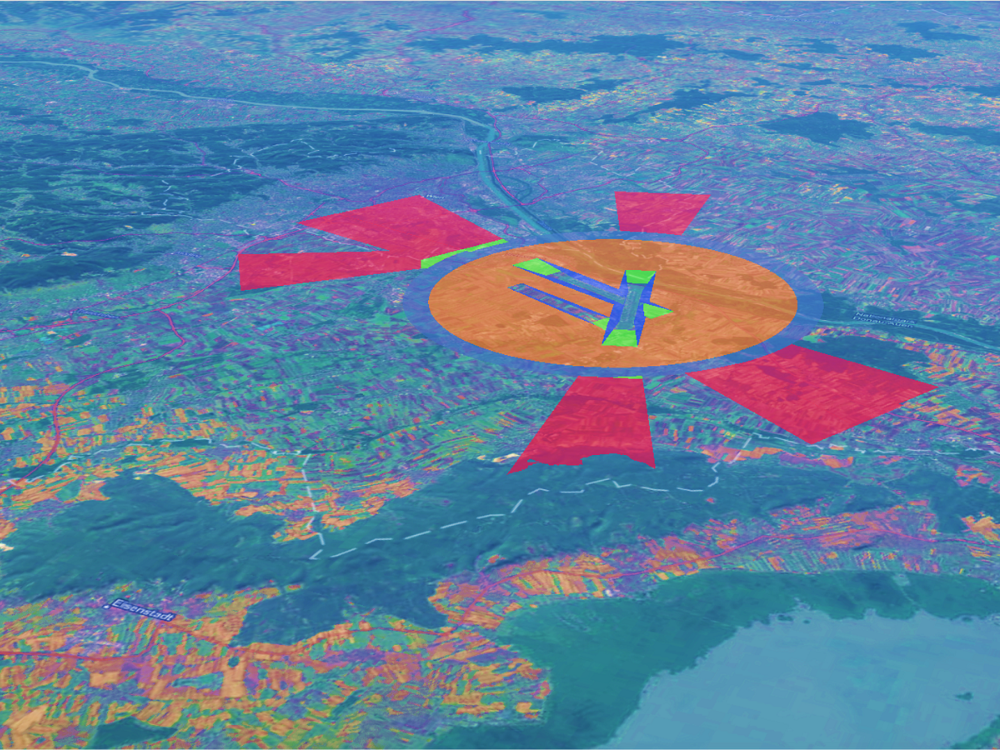
The Ukraine conflict is a daily headline in the news. There are reports of casualties, injuries, and destruction, often accompanied by remarks that the reported numbers cannot be independently verified and are not indisputably substantiated. However, facts and reliable information are crucial for assessing a situation accurately. As a geoinformatician, this has always bothered me, which is why I was eager to use the opportunity of my master thesis to examine the Ukraine conflict more closely. One particularly affected sector, if we believe the media reports, is agriculture. Yet, even with one’s own imagination, it’s possible to surmise that the fighting and bombings would not leave agriculture unaffected. Therefore, I wondered if I could use remote sensing methods to investigate in how agriculture has changed over the years due to the war. Specifically, it’s interesting to determine which of the spheres of influence in Ukraine is most affected: Is it the areas that have been under separatist occupation since 2014, those occupied by the Russian army, or perhaps the areas under the influence of the Ukrainian armed forces? To investigate this, three study areas were designated within their respective zones of influence.
Figure 2: Investigation sites in eastern Ukraine

What is my approach?
First, the question arises whether changes in agriculture are due to the war or rather to changes in the weather. For instance, if 2022 was an unusually dry year in Ukraine, it would also impact crop yields. Therefore, changes in agriculture would only be partially attributed to the conflict. To verify this, it is important to analyze climate data from recent years, considering possible fluctuations in temperature and precipitation. The next challenge is to determine the relevant agricultural fields for this study. Other land cover types such as forests or water bodies are not relevant to my research question and are, therefore, disregarded. The next step is to measure changes in the previously identified agricultural fields. Of particular interest are the state of vegetation and fallow lands.
Which methods are used?
Let’s begin with the analysis of weather data. Climate data can be obtained directly from the German Weather Service (DWD) for various stations in the region (DWD-Link). Using the programming language “R,” time series can quickly be generated to visually represent climate data as line graphs. R also allows for trend analysis of the respective period, adjusted for seasonal fluctuations.
So, how do we identify the agricultural fields? For this, I use satellite images from the Sentinel-2 satellite system. This system is operated by the European Space Agency (ESA) and provides high-quality images of the Earth’s surface. Here, you can find more information about ESA and Sentinel-2. These images are available for free as open-source data. Satellite images capture various ranges of light, including the visible light spectra of red, green, and blue, as well as infrared. To classify fields as “field” or “non-field,” an object-based approach is suitable. This approach divides a remote sensing image into smaller segments made up of image pixels. By aggregating the image pixels, homogeneous areas are represented more accurately. Small deviations, such as a tree in a field, are ignored in this approach, which enhances the quality of the classification. The analysis was conducted using “Google Earth Engine,” which allows for analyses to be carried out on Google’s server, providing quick access to a wide range of remote sensing data.
To analyze changes in the previously identified field areas, spectral indices can be utilized. These are mathematically formulated metrics that combine different ranges of electromagnetic radiation. The well-known NDVI index, for example, is generated by combining infrared and red light. This combination can highlight various characteristics, such as unhealthy vegetation in the images. Three indices were used to measure vegetation vitality, the amount of chlorophyll in plants, and the identification of areas with no plant cover. These indices can be represented as line graphs to see how the values have changed over time. If you want to learn more about indices, feel free to check this out.
What are the results?
Now that we’ve examined the methodology, the results are of particular interest. The analysis of weather data initially promises interesting outcomes. From the generated time series, it is evident that there were no exceptional weather conditions in 2022. The data suggests that the year of the Russian military incursion was relatively average compared to previous years. In terms of weather, 2021 was an optimal year for agriculture with average temperatures and sufficient rainfall, which is also reflected in the analyzed satellite images. The time series accurately shows the development of crops.
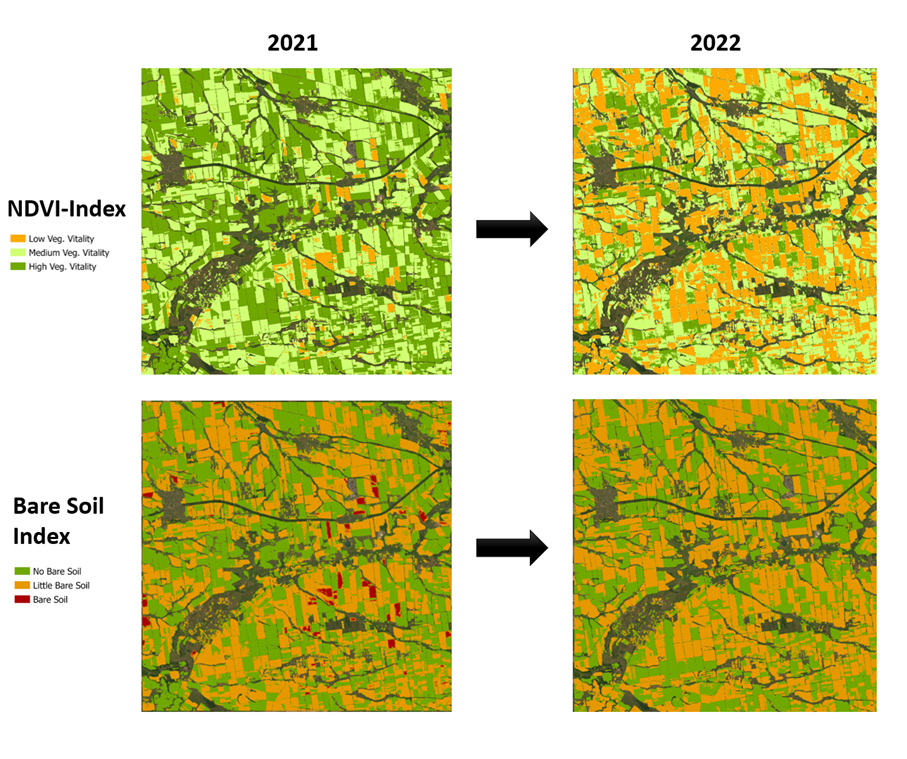
The classification of agricultural field areas worked excellently with an accuracy rate of over 91%. Interesting results were also yielded for the index values of the identified field areas. It is evident that highly healthy vegetation decreased by up to 94% from 2021 to 2022. In the figure below, one can clearly see the change in landcover from 2021 to 2022. Interestingly, in line with this, fallow lands did not decrease but rather increased. Therefore, after the Russian military incursion, there were fewer fallow lands. In addition, the chlorophyll content in vegetation dramatically declined in 2022.
But how can these results be explained? It is presumed that the fields were largely left to themselves. Vital vegetation declined because the fields were barely cultivated with crops. The fields were not tilled or fertilized during this time. Hence, weeds and smaller vegetation settled on the fields. This explains why most fields are mostly overgrown. The decline in chlorophyll is likely related to a decrease in fertilizers. Nitrates have a significant impact on chlorophyll formation. Thus, it can be assumed that there was a war-related reduction in fertilizers. The fields were probably not adequately sown, plowed, or fertilized since the beginning of 2022.
Figure 3: Example of changes in the investigation site under control of Ukrainian forces
The area that has been under separatist control for a longer period is the most affected. The area under Ukrainian control is the least affected. It can be concluded that the war has had a significant impact on the supposedly “peaceful” areas under Russian control. In summary, agriculture has been heavily influenced since the beginning of the war. It is not only the areas under Ukrainian control but particularly the areas under the control of the aggressors that are affected. You can find another interesting contribution on this topic here.
Final thoughts
My master thesis demonstrates the fascinating applications of Geoinformatics. Unlike many other fields, complex and unclear phenomena can be illuminated through Geoinformatics-methods. Only through verifiable and secure information action can be taken. In the era of “fake news,” this is an important point for making an impact and contributing to a better understanding of conflicts. Even though the Ukraine conflict is being fought on the shoulders of the Ukrainian population with terrible losses, it is our duty to stand against misinformation and strive to understand conflicts in order to respond effectively.
About the author: Torge Brunhorn (UNIGIS Master graduate)
 Torge Brunhorn (26) studied Geography and Geoinformatics in Göttingen and Salzburg. As a UNIGIS graduate, his interest focuses on earth observation and remote sensing. He works for the German Air Traffic Control in Langen.
Source title image: Pexels


